Signals From VARA Pro Q3/2025
Estimates versus Actuals
Companies still struggle to meet the top line expectations. After 30% in Q2 2025 only 36% came out with better than expected sales numbers in Q3 2025.
However, 75% of our companies beat the bottom line expectations in Q3 205, which is historically seen on the high level (median for 2/3: 58%) and consirable higher than in Q2 (59%).
Sales and Earnings Growth
Since two years the current situation has shown very modest to negative growth rates and is currently stagnating. As the expected rebound has not happened the top line estimates went down from 8,0% in Q2 to 3,1% in Q3.
In the low growth phase the companies have successfully increased the margins and hence showed modest earnings growth.
TTM (Index)
The sales growth has stagnated since 2023. Despite stagnating top line the earnings grew steadily. But how long can this last with our tiop line growth?
Estimates Compass
We entered in Q3 2025 in trough phase. Both expectations and current situation improving compared to Q2. The current situation is still on the negative side, but the expectations are again on the positive side.
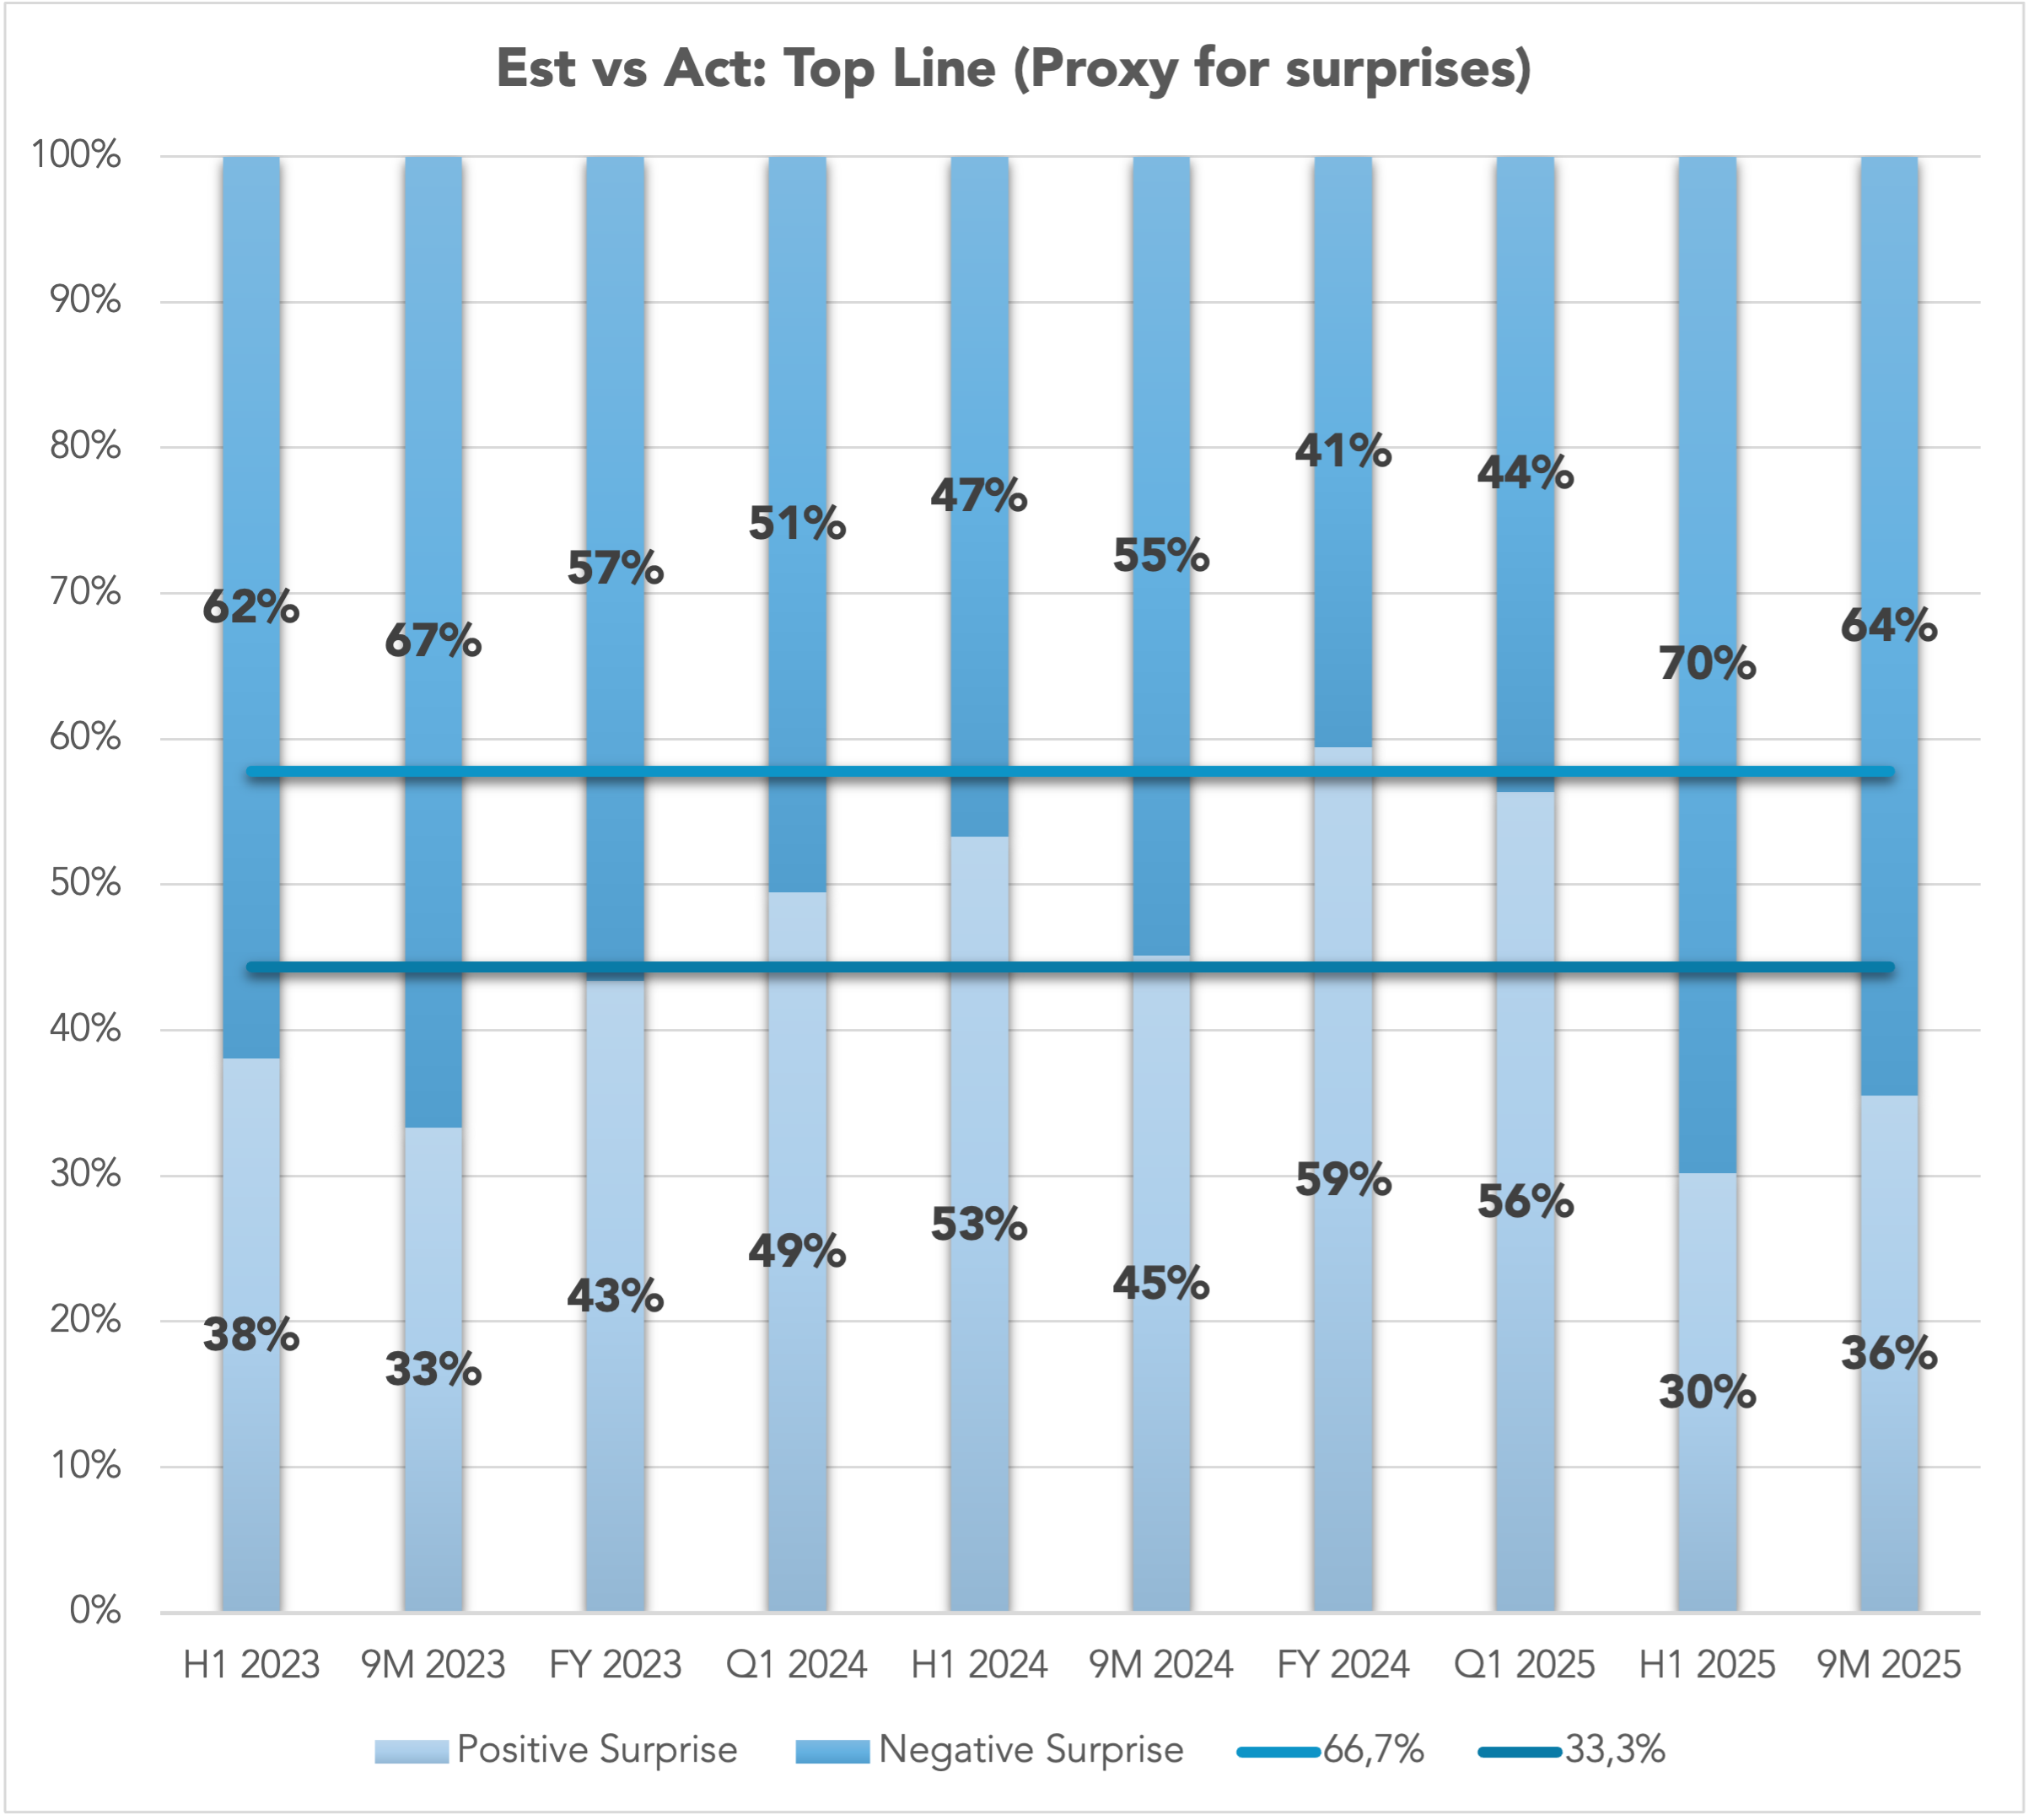
Estimates vs. Actuals: Top Line Q3/2025
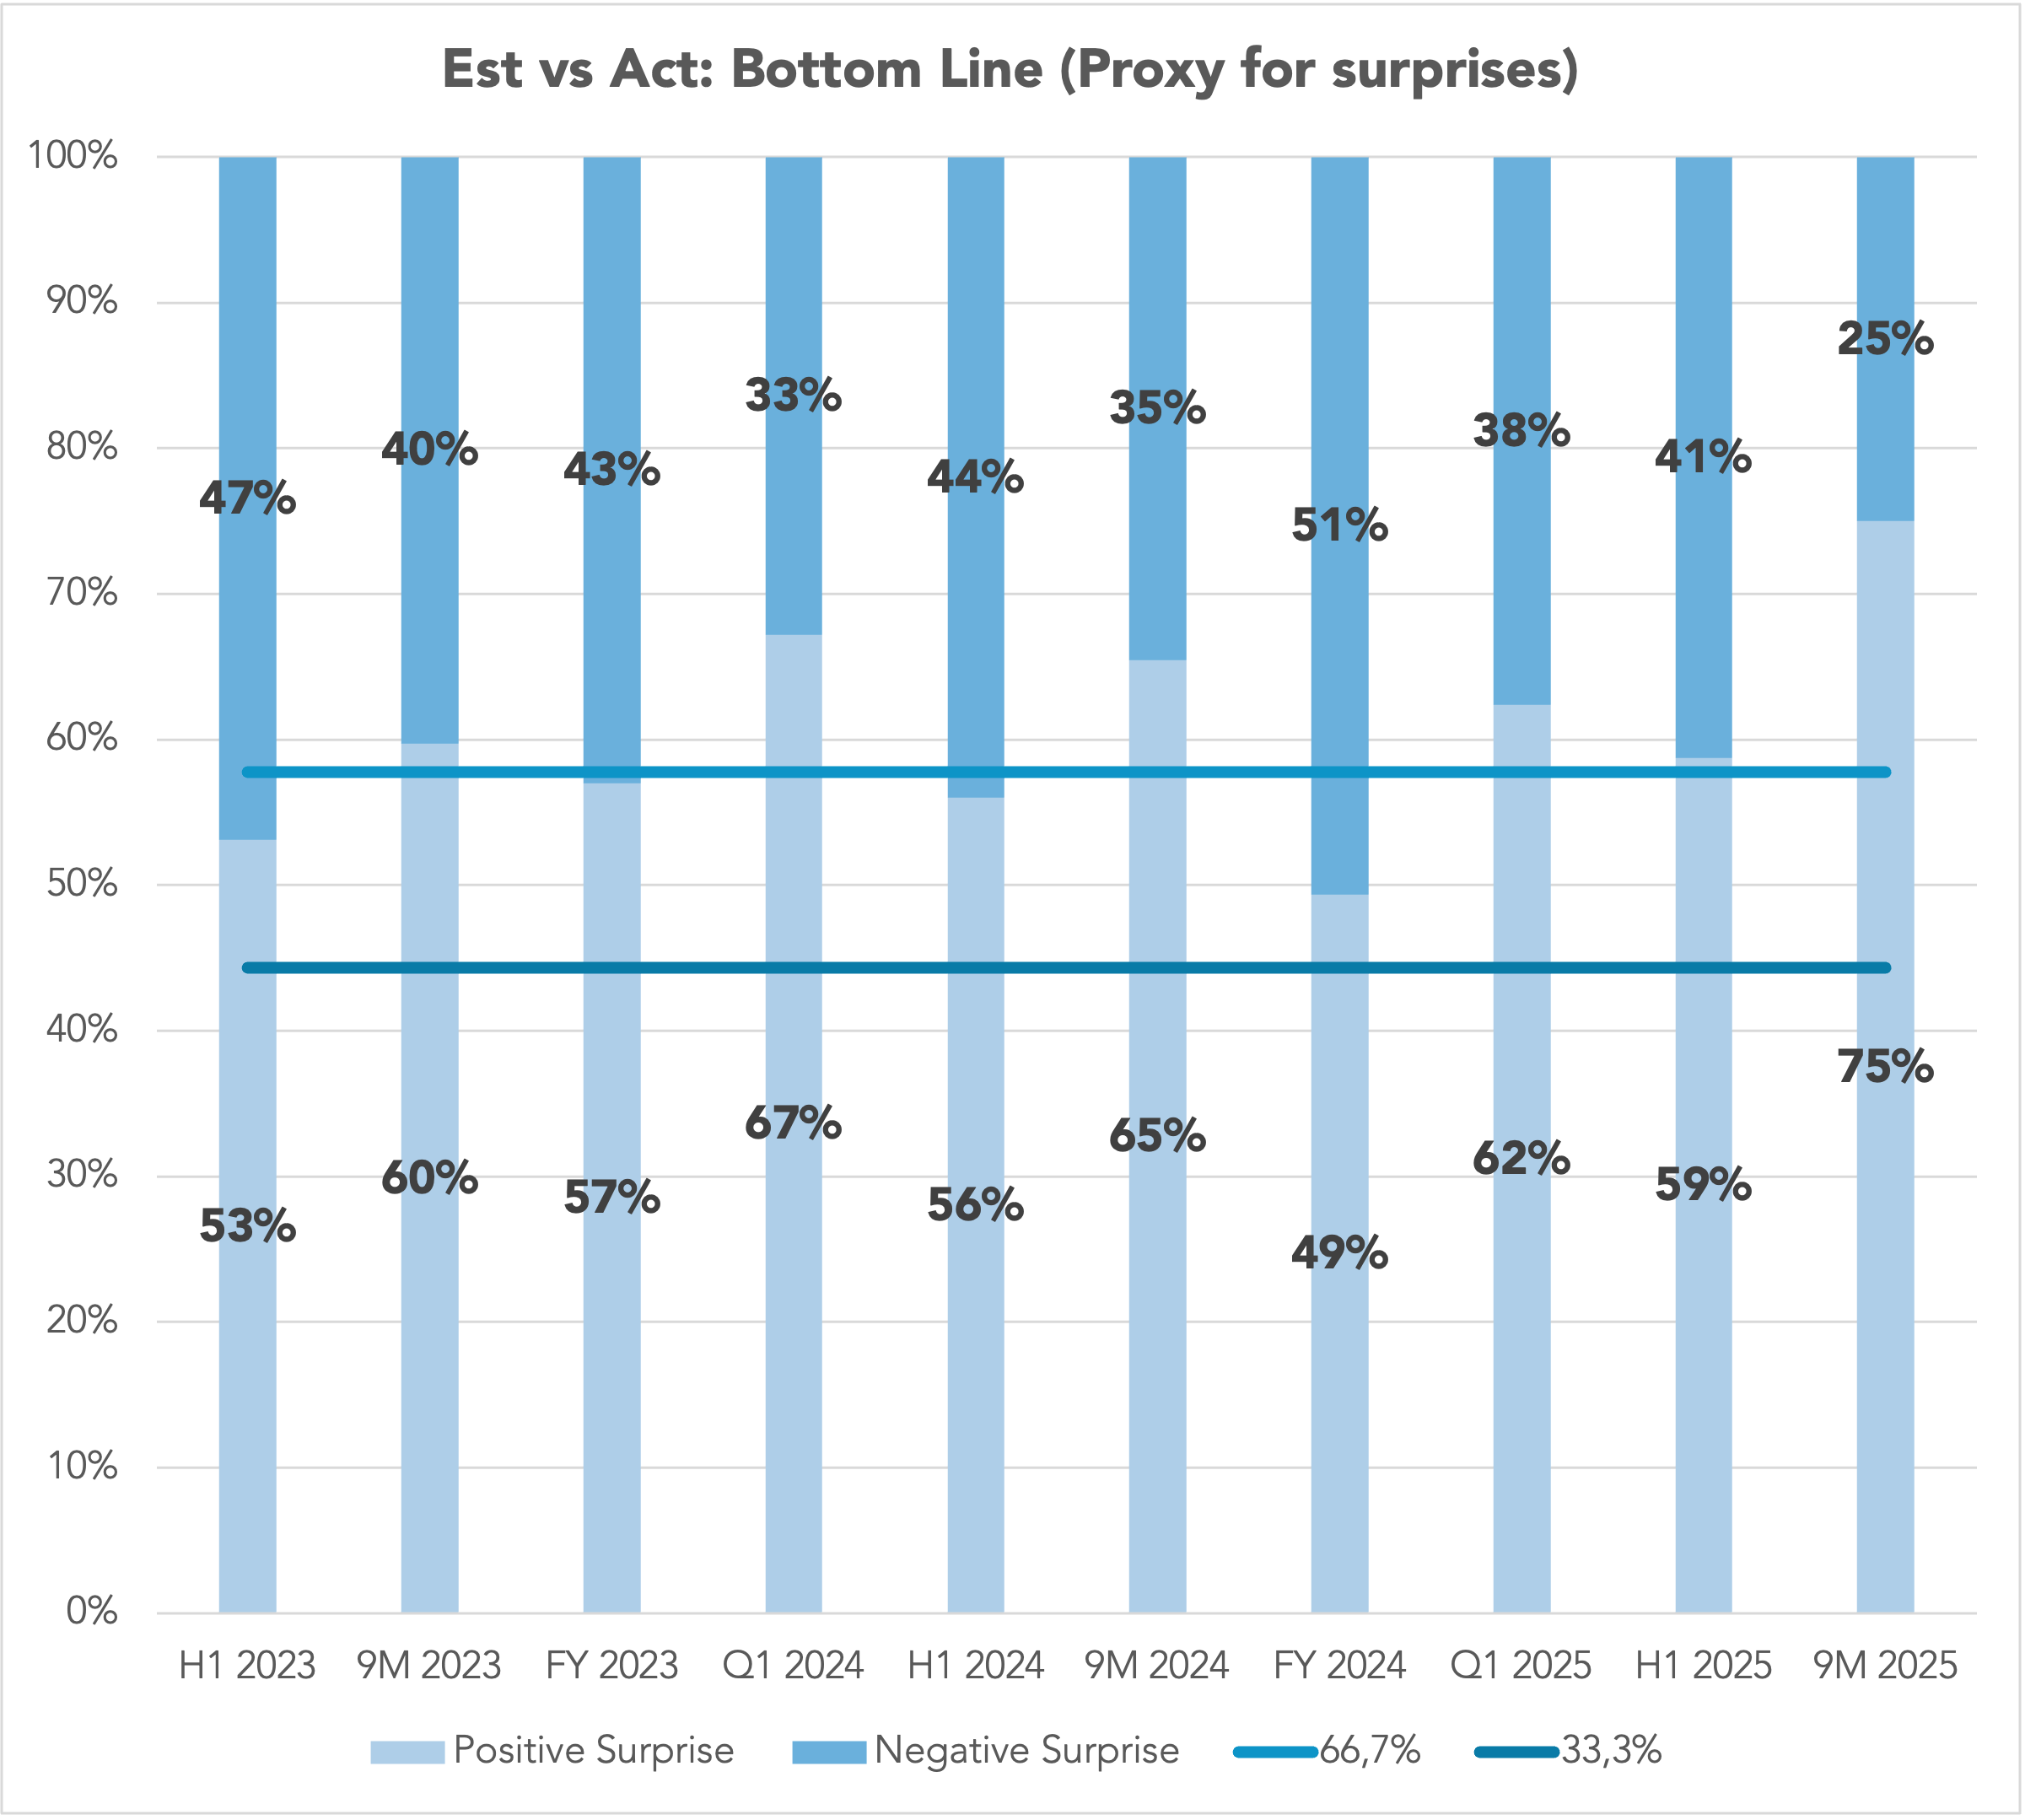
Estimates vs. Actuals: Bottom Line Q3/2025

Top Line Growth Expectations: 12M Forecast/TTM, Q3/2025
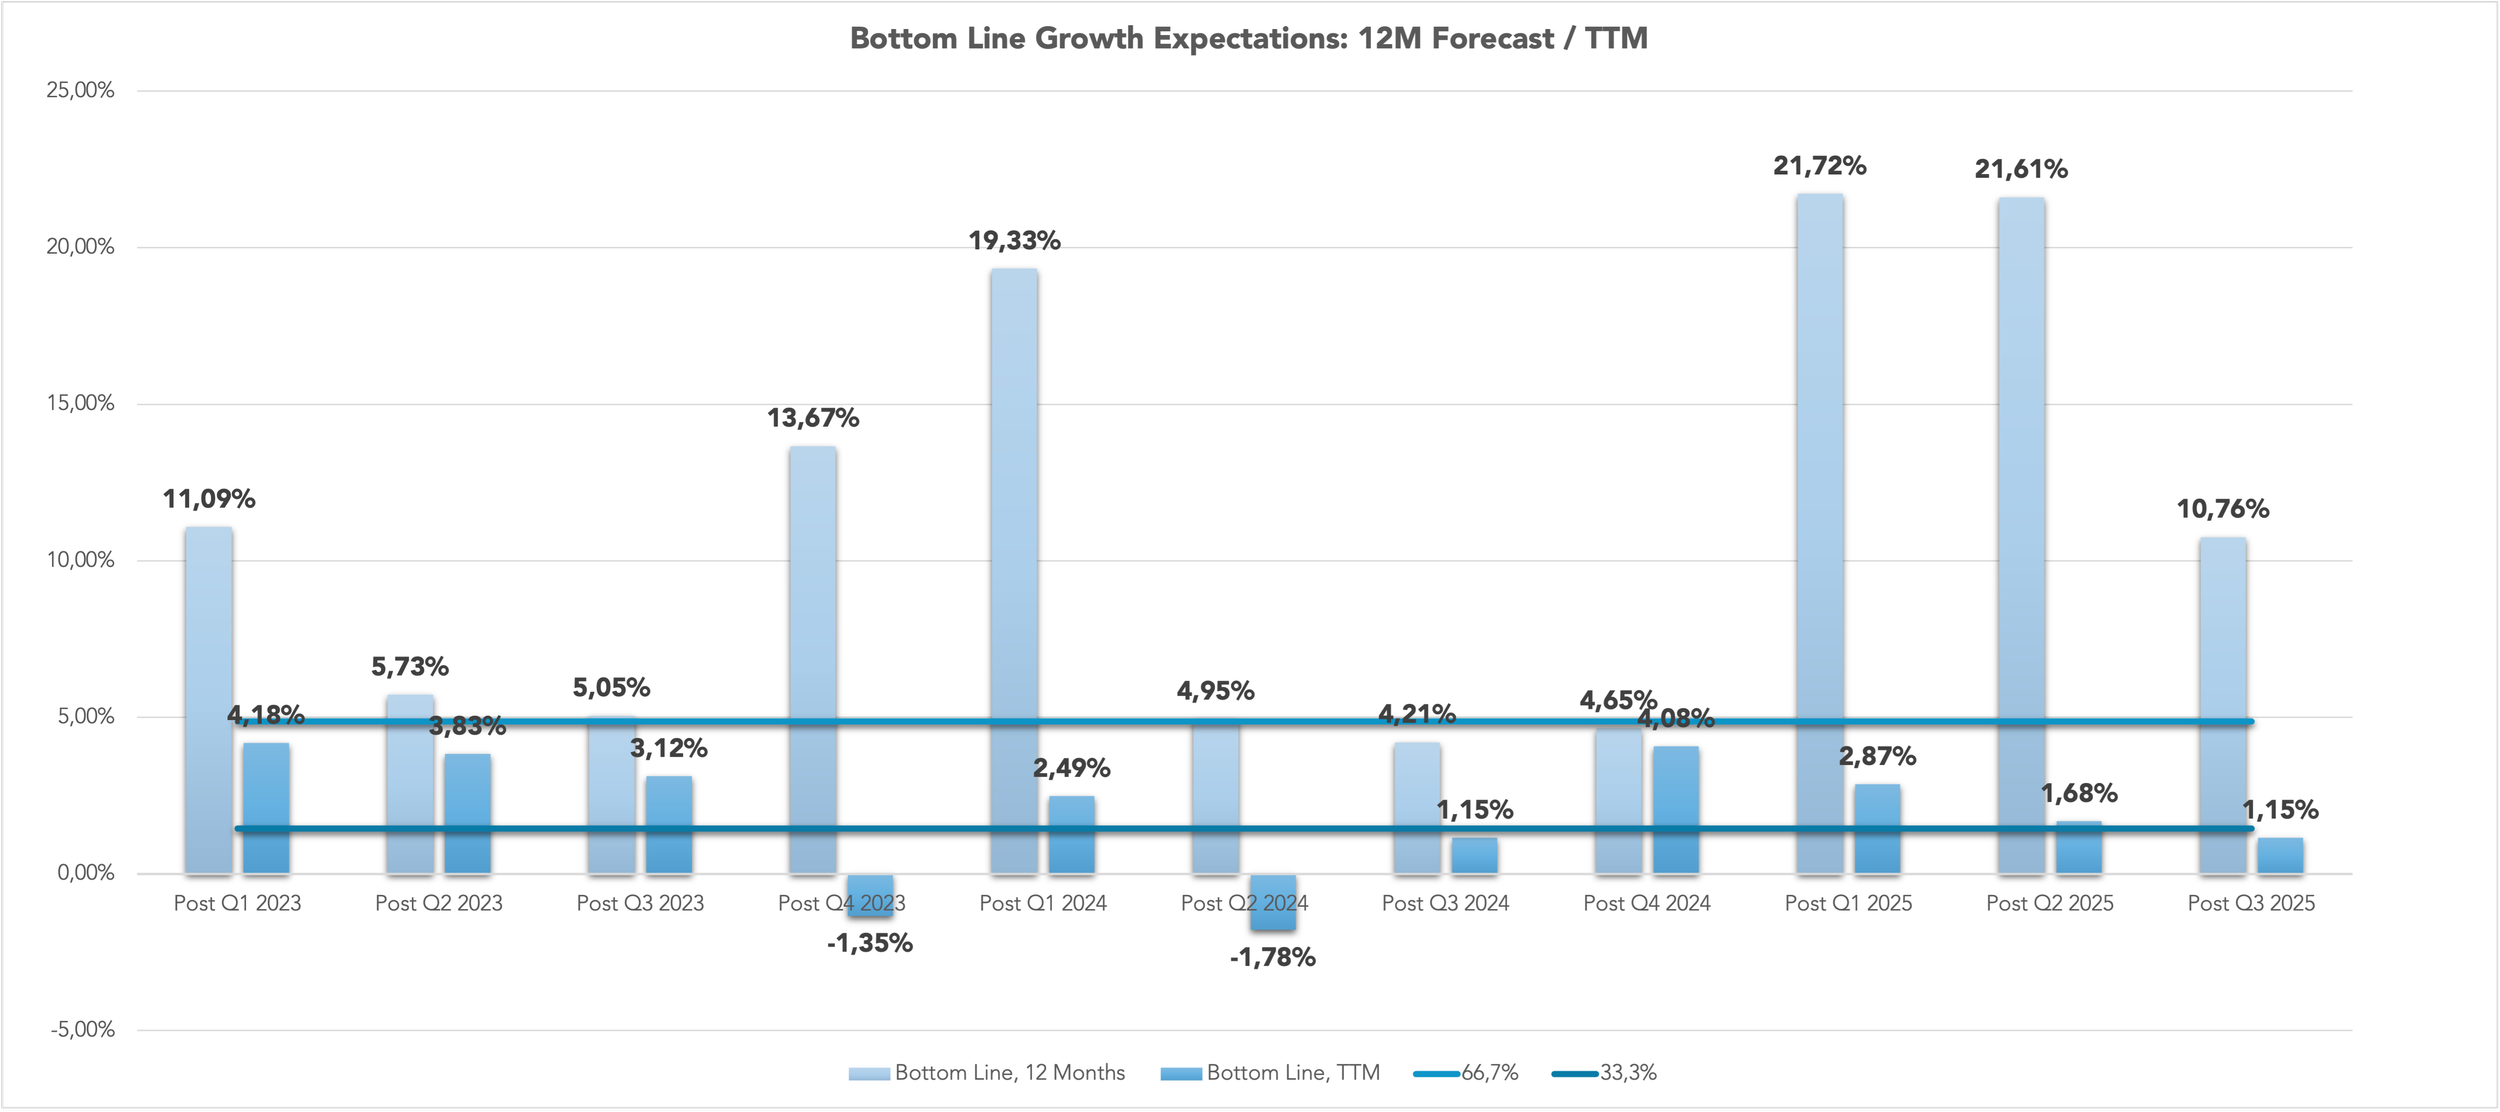
Bottom Line Growth Expectations: 12M Forecast/TTM, Q3/2025

TTM (Index), Q3/2025
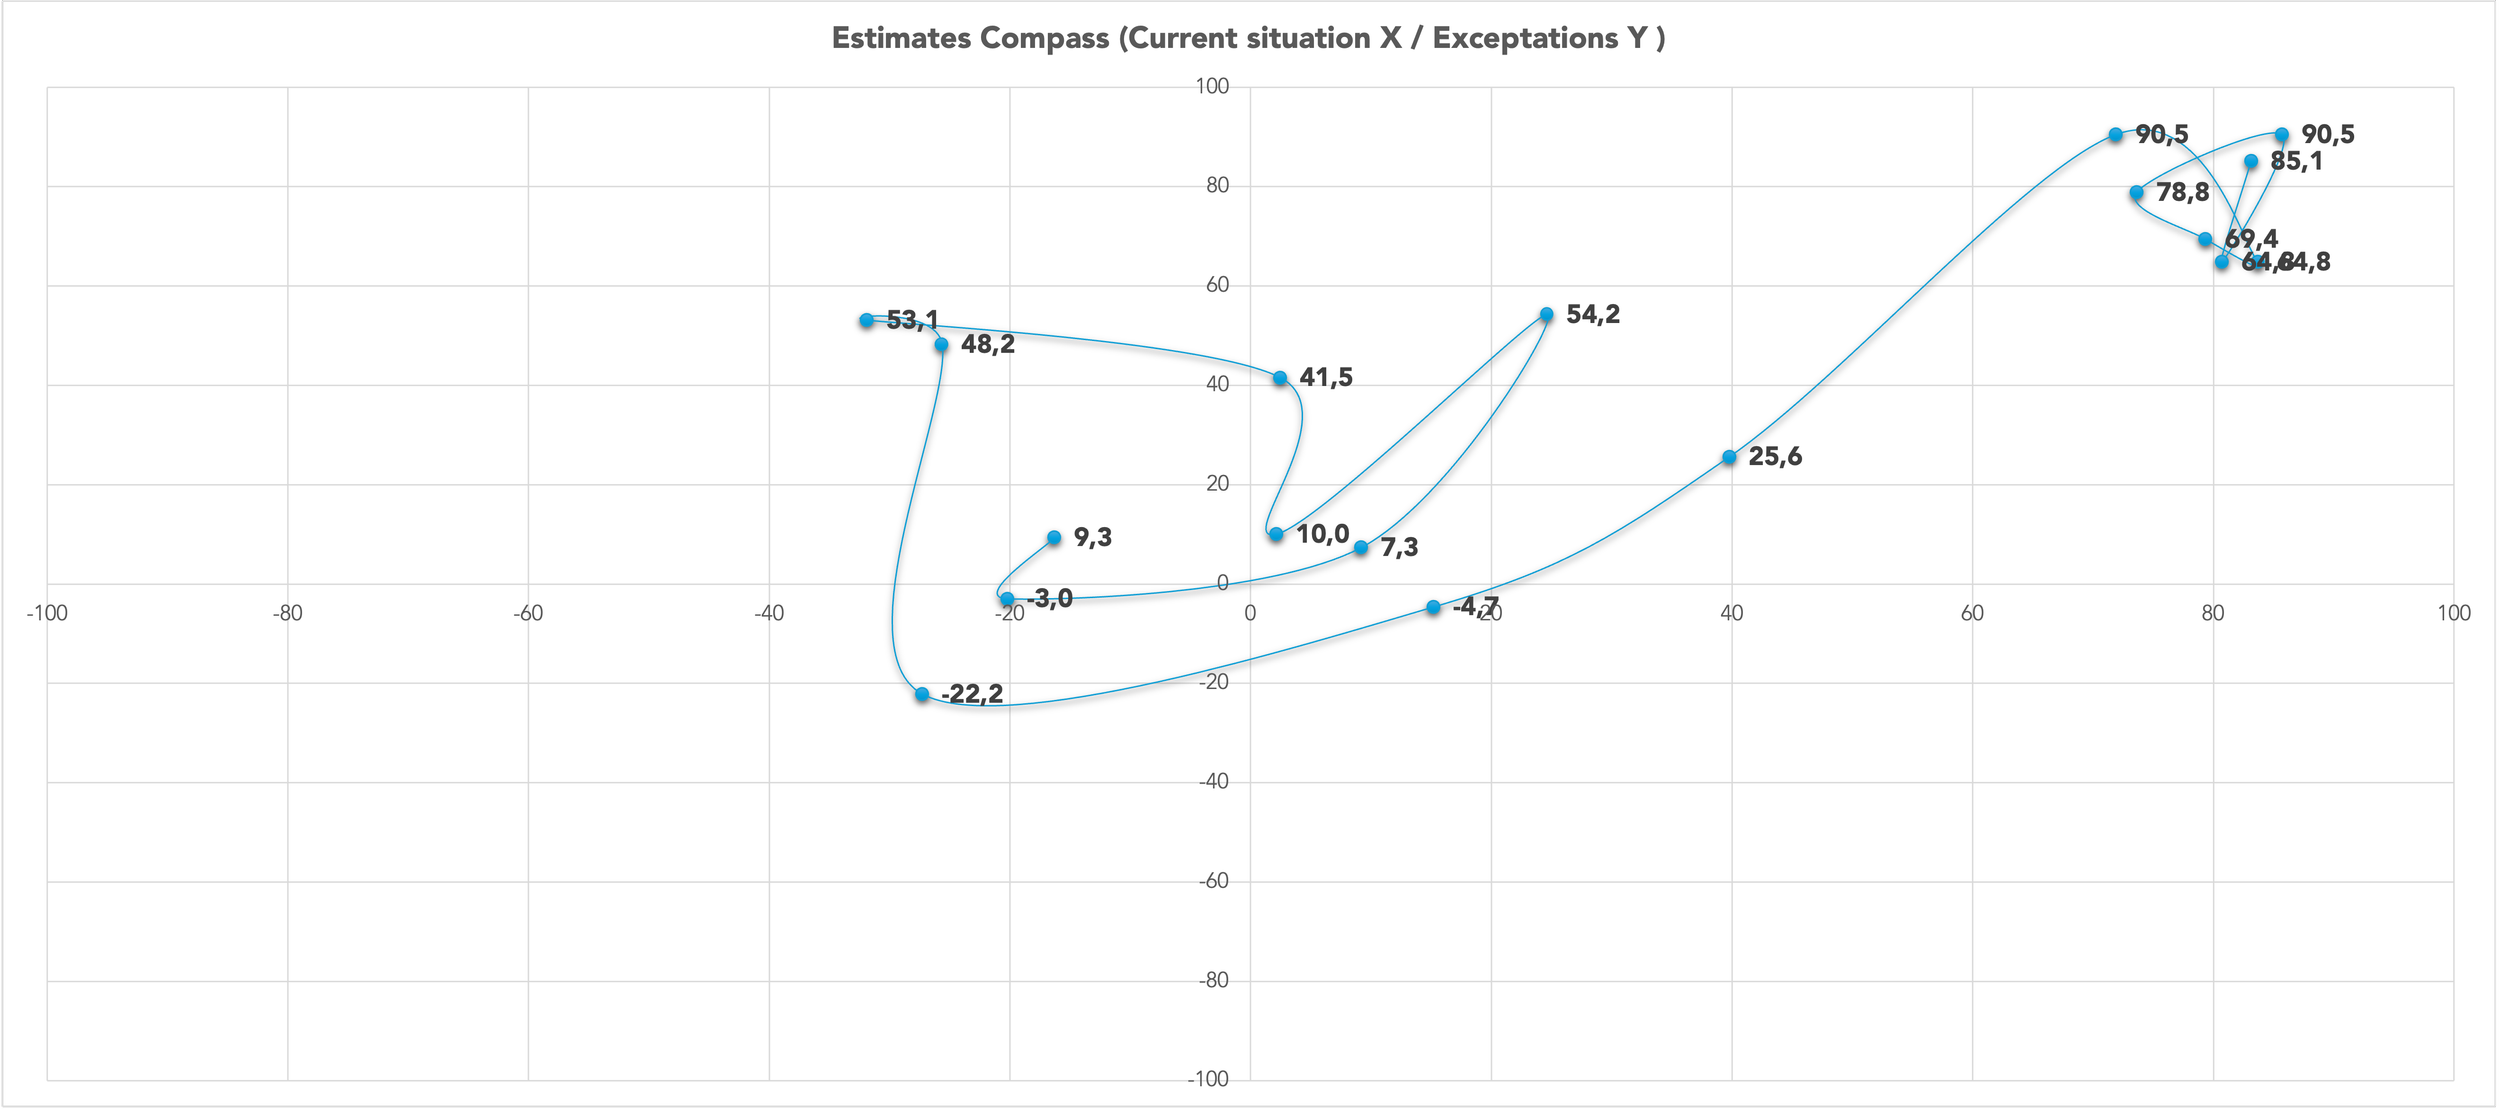
Estimates Compass, Q3/2025